Interpreting
Diagrams
Diagrams
generally are of three
types: generalized diagrams, diagrams that represent processes, and
biological
drawings. Generalized diagrams show
biological features (these are not a drawing of any particular specimen
but an
interpretation by an artist/biologist to show the features of something
e.g. a
drawing of an animal cell or a nephron). Diagrams that represent
processes usually
are showing the relationship between several steps in a process e.g. a
diagram
to explain “the triplet code” or the “Loading and unloading of
respiratory
gases” in mammals. Biological drawings are actual drawings of specific
biological specimens showing the precise detail that one can see either
with
the naked eye or microscope. Textbooks usually only have the first two
types
unless they are showing a photograph of something with an accompanying
biological
drawing. The diagrams that you must know for the first year courses are
listed
in the “Course Outline”. Exams may also test your ability to apply your
knowledge
and analyze diagrams that you have never seen before.
Interpreting
Generalized
Diagrams
Generalized
diagrams can be used as a reference for
interpreting actual biological specimens (in the lab) or for
visualizing and
learning content of the course such as the
name, shape, size, features of structures and
their position relative to other structures.
One
of the best ways of learning material like this is to draw your own diagram of the generalized
diagram. The
first time you draw it, draw
and label it while looking at it. Concentrate on the
size, shape,
position and features of the structures so that your drawing is
accurate. Next compare your
diagram to
the original and make sure all details of the
diagram are well represented and labeled correctly. Test
how
much you learned by drawing and labeling it again this
time without looking at it. Again
compare your drawing with the
textbook diagram and make
sure there are no missing elements. If there are errors or omissions
keep on
drawing, labeling and checking it until you are certain that you can
replicate
the drawing on demand.
For
students
in Biology 1002 try this technique on
the
following diagram of a nephron, copied from “Biology 6th
edition” by
Campbell and Reese.

Using Generalized
Diagrams as
References in the Lab
Generalized
diagrams can be used as a means of interpreting what you see with your
naked
eye or with the microscope. Since the size, position, colour,
orientation or
other features of the structures of your specimen may look different
from the
diagram you may have to make some inferences (reasoned conclusions) as
to what
the structures are on your specimen. Some people have no trouble
guessing what
a structure looks like from another view but others struggle with the
concept.
The more practice you get at interpreting specimens from diagrams the
better
you get at it. Suppose you saw structures on your specimen that looked
like
this:
They
may
in fact be structures that are represented on the diagram as: 

So
you can
see that sometimes some interpretation is required. Often by looking at
a
number of diagrams of the same structure you get a better idea of
whether you
are correct in your interpretation. In any case this is a valuable
skill to
develop in the lab. The advantage of trying to develop this skill in
the lab is
that there are lots of people that can help you.
A few students completely
misunderstand the
purpose of reference diagrams in the lab. Instead of using reference
diagrams
to interpret specimens and developing those all important interpretive
skills they
simply copy the diagram and go home and memorize the diagram for the
lab exam.
Unfortunately they find out on the lab exam that they won’t be asked to
simply
label a reference diagram that they have studied but they are asked to
draw a
diagram of a specimen and label it. Students that have not developed
the
interpretive skills cannot effectively draw and label their own
diagrams.
Copying and memorizing diagrams does not help with the development of
interpretative skills.
Interpreting
Diagrams that
Represent Processes
Textbooks
attempt to clarify how processes work by means of diagrams. Mostly
these
diagrams are an attempt to help students visualize the steps of
processes and
see how the steps are related to one another.
In “Biology 6th ed.” the
authors (Campbell and Reese) usually have a detailed word description
of the
steps in a process written under the diagram. In order to understand
the
diagram you first must understand the content that the diagram
represents from
the text. Next you have to relate
the
written description under the diagram to the diagram itself. Sometimes this can
take a long
time to interpret and digest. If you do this stepwise you can draw your own version of the diagram in
understandable
steps and write what is going on in each step on your
diagram.
Sometimes it is hard to see where to
start on the diagram other times it easy. Some diagrams actually number
the
steps on the diagram for you and give you a written description of each
step
(this is particularly true for life cycles: See Fig. 30.17: The life
cycle of
an angiosperm Campbell and Reese (6th Ed.)). In some
diagrams, the
process starts at the top of the diagram and proceeds to the bottom
e.g. Fig.
17.3 Campbell and Reese (6th Ed.) and in others they start
at the
left side and proceed to the right e.g. Fig 9.6 Campbell and Reese (6th
Ed.). Some diagrams do not have a set starting point and/or may lack
the
written description underneath the diagram such as Fig
42.27 Campbell and Reese (6th
Ed.).
After
you
have pieced apart the diagram into steps and written a description of
each step
on your diagram you might try to create
your own written description of the diagram. Make reference to your
own figure and use your own
words. Reread the information under the figure from the book and see if
you
have omitted or misrepresented any content.
Biology 1002
students try
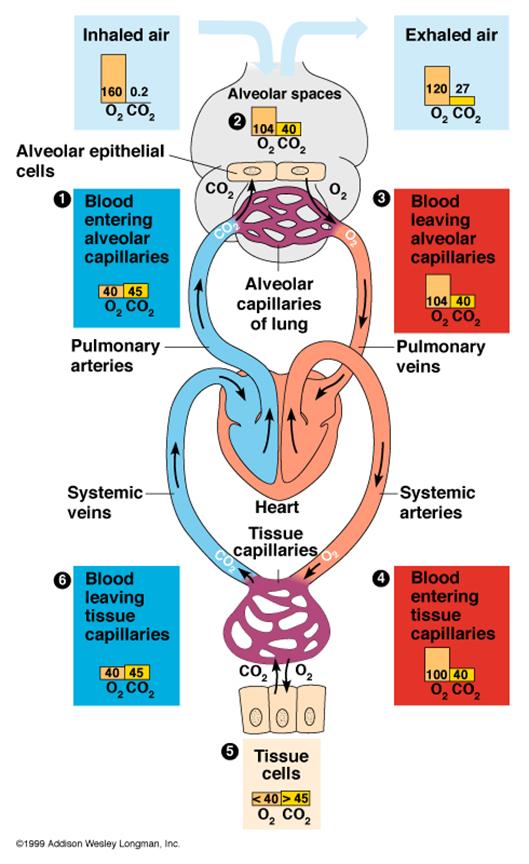
this exercise with Fig 42.27 Loading and unloading of respiratory gases
from
Campbell and Reese (6th Ed.) p 894.
Biology 1002
students may
want to construct their own diagram of a process. Go to Processing
Information/concept Maps/Concept maps 1002/ “Concept Map Exercise 1002
a
process” and try to draw your own word description of homeostatic
control of
water balance by ADH.
--
------