Newfoundland is Canada's tenth province.
It joined the Canadian federation in 1949. The 1996 census recorded a provincial
population of 570,711, which amounted to only 1.9 percent of that of the
entire country. The population has been roughly stable over the past two
decades, but has been declining recently in response to adverse economic
conditions.
The province's gross domestic product in
1996 amounted to C$10 billion, or C$17,600 per person, a level that was
only 68 percent of the Canadian average.(2)
The impact of this relatively low level of productivity on living standards
is alleviated by a substantial ($2.1 billion in 1996) import surplus, financed
mainly through federal government operations and transfers.
Canada is a federal country, and so government
responsibilities are allocated constitutionally between the federal government
and the provinces. Fisheries management is the responsibility of the federal
government, but the provincial government has jurisdiction over on-shore
processing activities through its responsibility for "Property and Civil
Rights in the Province." However, processors who wish to export their product
are regulated as well by the federal government, which has jurisdiction
over international trade.
Historically, the fishery has been the
mainstay of the Newfoundland economy (Copes 1970). The first occupational
census, collected in 1857, reveals that in that year, fully ninety percent
of the male labour force was engaged in the catching and curing of fish
(Table 1). Inevitably, this ratio declined as economic
development proceeded, but was still quite substantial at the time of Confederation
with Canada. Since then, however, the census figures show a precipitous
decline in the importance of the fishery in providing employment to the
local labour force up to 1961 (after which the proportion appears to have
stabilized). The census data suggest that only about five percent of the
labour force now make a living as fishers.
However, other evidence suggests that these
figures may underestimate the economic importance of the industry. For
one thing, the fishery is of significant regional importance within
the province; there are areas in which the fishery is the only significant
employer. For another, there are two classes of workers that are not captured
in these census statistics: part-time fishermen who may be classified in
some other occupation, and fish plant workers. As for the former, the Department
of Fisheries and Oceans, the federal government department that regulates
fisheries, registered over 14,000 full-time fishermen and over 10,000 part-time
fishermen in 1991;(3) however, most of the
part-timers probably were not actively fishing.(4)
|
|
|||
| Year | Fishing Occupations | Total Labour Force | Percent Fishermen |
| 1857 | 38,578 | 42,671 | 90.4 |
| 1901 | 41,231 | 67,368 | 61.2 |
| 1945 | 31,634 | 101,899 | 31.0 |
| 1951 | 18,342 | 106,411 | 17.2 |
| 1961 | 8,183 | 112,310 | 7.3 |
| 1971 | 7,260 | 147,990 | 4.9 |
| 1981 | 12,030 | 222,475 | 5.4 |
| 1991 | 12,690 | 267,155 | 4.8 |
| Source: For the years 1897-1945, "Male population engaged in catching and curing fish," Census of Newfoundland and Labrador, 1935 for 1857 and 1901, and Census of Newfoundland, 1945 , as reported in Copes 1970, Table 3. For the years 1951-1981, " Occupational group: Fishermen, Trappers & Hunters," Census of Canada, 1951, 1961, 1971, 1981, 1991, as reported in Historical Statistics of Newfoundland and Labrador, Volume I(1), Table C-5, and Volume II(VII), Table C-4. | |||
Assessing the employment impact of the
processing sector is even more problematic. The 1993 Task Force on Incomes
and Adjustment in the Atlantic Fishery (Cashin Task Force), despite the
expenditure of considerable resources on the question, found it quite difficult
to come up with a hard number. However, Statistics Canada Taxfiler data
and a DFO Plant Survey suggest employment in the range of 27,000 in 1990.(5)
This is not full-time employment; for example, Statistics Canada's Census
of Manufacturers (which admittedly covers only the larger plants) reports
full-time-equivalent employment of 9,000 workers in 1990.(6)
The contribution of the fishing industry
to production is documented in Table 2. Since 1971,
fish products have accounted for a stable but small (5-7 percent) proportion
of production in the Newfoundland economy. A striking trend revealed in
this table is the very sharp increase in the relative importance of the
services sector to the Newfoundland economy.(7)
Indeed, in contrast to other goods-producing industries, and particularly
other primary industries (e.g., forestry, mining), until recently the fishery
has at least held its own.
|
|
||||||||
| 1971 | 1981 | 1989 | 1992 | |||||
| $ mil. | % | $ mil. | % | $ mil. | % | $ mil. | % | |
| Fishing and fish productsa | 59 | 5 | 247 | 6 | 449 | 6 | 295 | 4 |
| Other primary industries | 153 | 13 | 539 | 12 | 418 | 6 | 372 | 5 |
| Other goods production | 337 | 28 | 981 | 22 | 1,493 | 20 | 1,576 | 19 |
| Total goods production | 549 | 45 | 1,766 | 40 | 2,360 | 31 | 2,243 | 27 |
| Total services | 670 | 55 | 2,630 | 60 | 5,226 | 69 | 5,965 | 73 |
| Total goods and services | 1,219 | 100 | 4,396 | 100 | 7,586 | 100 | 8,208 | 100 |
| Source:
Statistics Canada, cat. nos. 13-213 and 15-203, as reported in Historical
Statistics of Newfoundland and Labrador, Volume II(VII), Table F-4.
Note: A redefinition of wages and salaries in 1984 makes the series before and after this date not directly comparable. aIncludes fish processing. |
||||||||
While a number of factors might be involved
here, attention should be drawn to the very substantial rise in federal
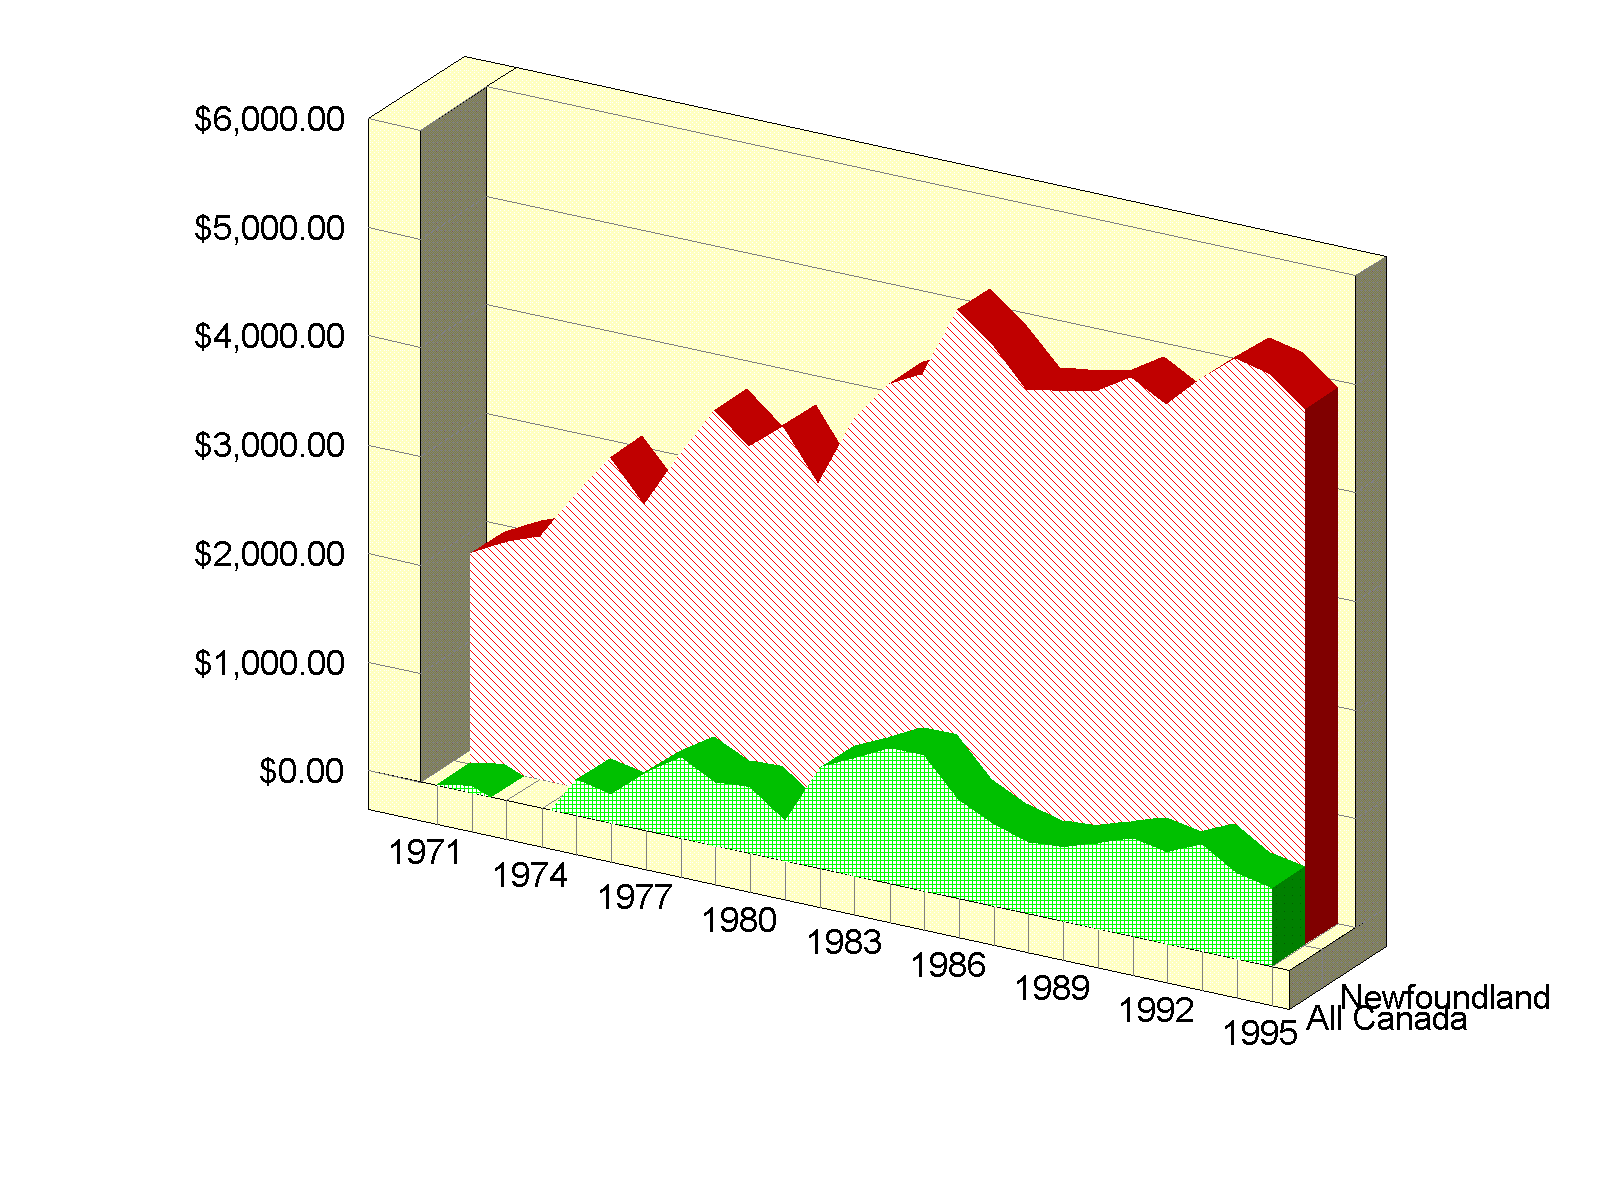
government involvement in the Newfoundland economy over the period. Figure
1 depicts the per capita level of the federal government deficit, both
overall and within Newfoundland, in 1986 dollars over the period 1971-1995.
The difference between these two series can be interpreted as the regional
redistributive impact of the federal budget in this period. This redistributive
impact has averaged about $4,000 per person (in 1986 dollars) over the
past decade,(8) and has permitted an expansion
in the public sector at both the federal and (through intergovernmental
transfers) provincial levels in Newfoundland. This public expenditure alone
would have accounted for much of the expansion in the services sector noted
above, since these government activities are largely recorded as service
industries.
Three events in the post-war period have
had a major impact on the industry. The first event was the very heavy
exploitation, beginning in the 1960's, by distant water nations of stocks
traditionally harvested by Newfoundland fishermen. The second was the extension
of jurisdiction by Canada over the major portion of these stocks in 1977.
The third was the moratorium imposed in 1992 and 1993 on fishing most of
these stocks as a result of severe stock depletion. The impact of these
three events on the northern cod stock (known officially as 2J3KL cod,
after the NAFO divisions in which the stock is harvested), the most important
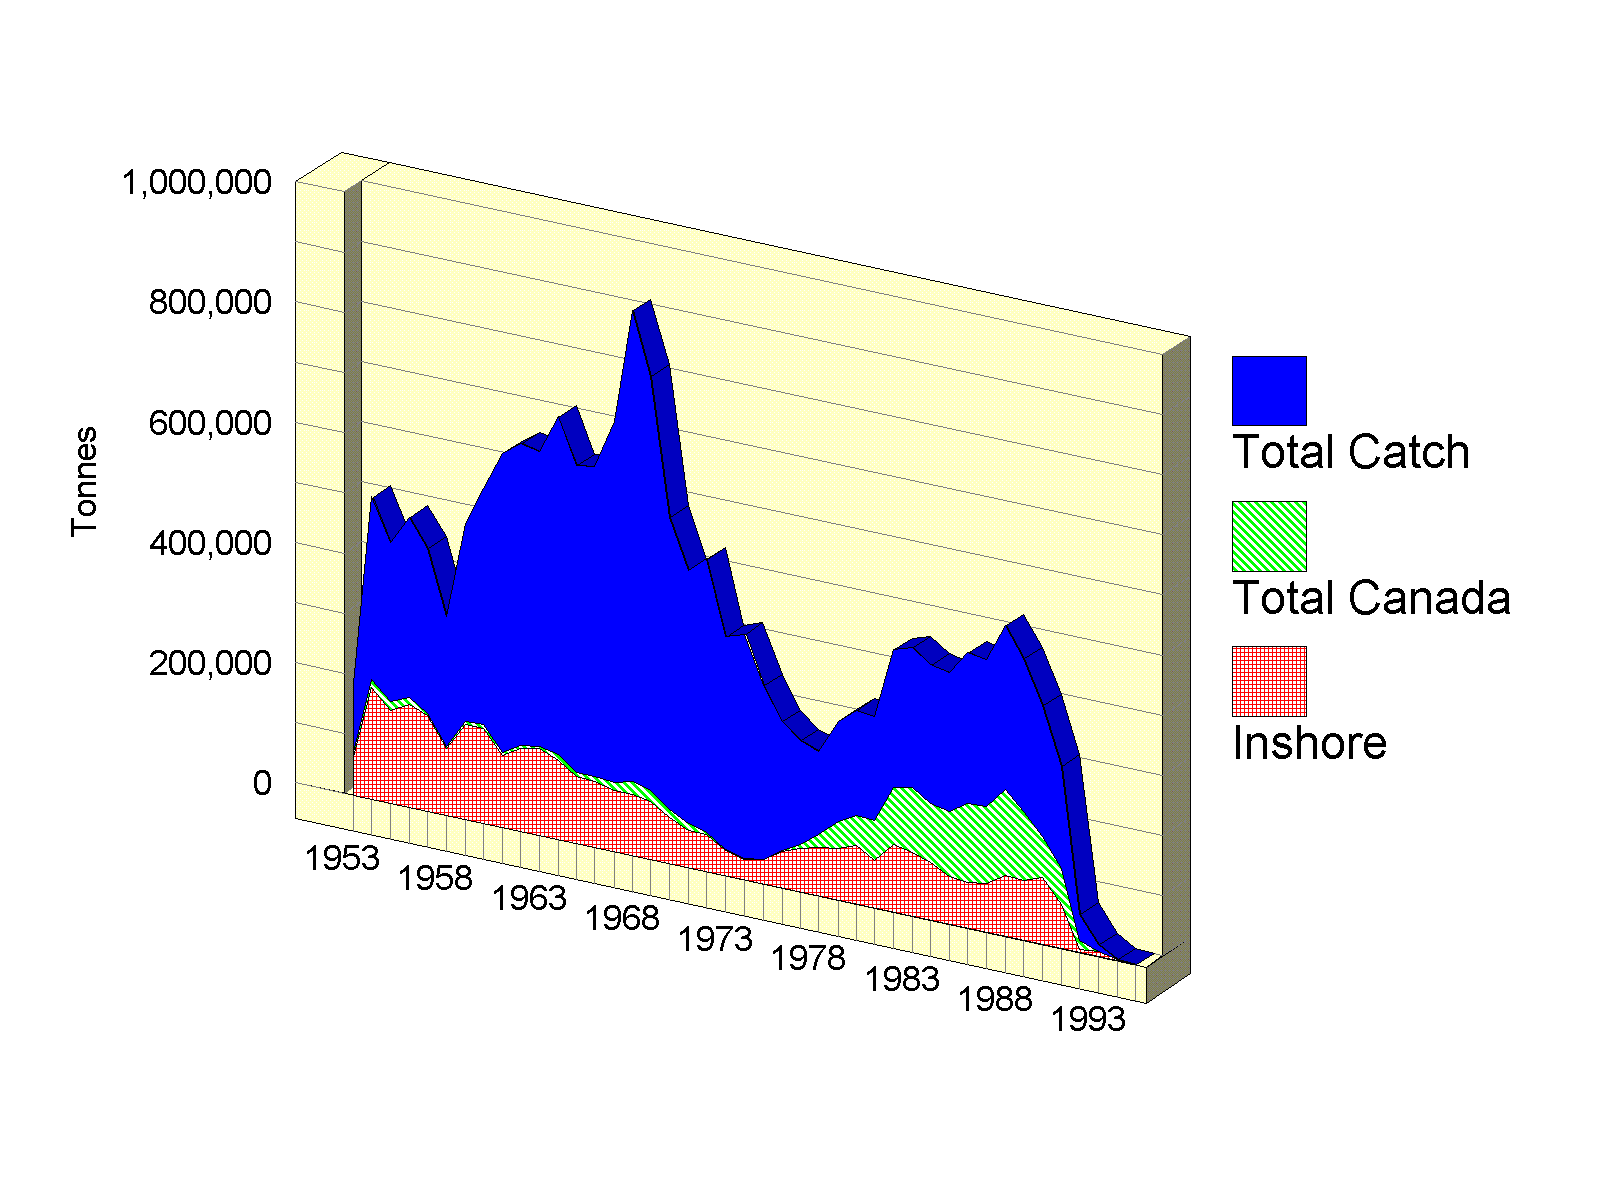
stock for the Newfoundland fishery, is clearly apparent in Figure
2 below.
There has always been some distant-water
participation in the fisheries off Newfoundland going back at least to
the sixteenth century (Innis 1978), if not earlier. However, in 1959-60,
distant water nations began to increase substantially their exploitation
of northwest Atlantic groundfish stocks. By 1968, total catches were about
2½ times the level that was being experienced in the 1950's. While
this increase was clearly unsustainable, the impact on catchability was
initially fairly modest, and Canada was able to maintain its groundfish
catch at levels close to those prevailing in the 1950's. However, the less
mobile inshore cod fishery began to show markedly reduced catches in the
mid-1960's, and this reduction induced a drop in the number of fishermen
beginning in 1965.
After 1968, the effect of exploitation
beyond maximum sustainable yield became apparent, and total catches began
to decline despite increased offshore effort. In Newfoundland, total fish
landings began to decline, at first marginally and then more precipitously.
The inshore northern cod fishery was particularly hard hit, and catches
fell to 35 thousand tonnes in 1974, as compared with a post-war peak of
185 thousand tonnes in 1954. This reduction was reflected in a decline
in the number of fishermen to 12,000 in 1974, from 22,000 only ten years
earlier.
Government response to the crisis was twofold.
First, the federal government took a more aggressive posture within the
International Convention for the Northwest Atlantic Fisheries (ICNAF),
the heretofore ineffective international regulatory body responsible for
managing these stocks (Munro 1980, ch. 3). This new aggressiveness resulted
in reduced allocations of groundfish stocks to the distant water nations,
and ultimately (in 1977) in the establishment of Extended Fisheries Jurisdiction
(EFJ) within 200 miles of the coast. Second, government financial support
for the industry, already substantial, received a major increment in 1974
and subsequent years, and for several years actually exceeded the value
of the catch in Newfoundland. We have documented (Schrank, Skoda, Roy and
Tsoa, 1987) and discussed the political implications (Schrank, Ommer, Roy,
and Skoda 1992) of this increase elsewhere, and so we will not pursue the
matter further here. The effect of Extended Fisheries Jurisdiction, however,
does merit further examination.
For these two reasons, the establishment
of Extended Fisheries Jurisdiction generated a wave of optimism in the
industry, which expected to be the beneficiary of a vastly increased share
of a properly managed stock. In fact, landings in Newfoundland nearly doubled
in real terms from 1974 to 1979.
Despite this increase in landings, it is
fair to characterize the outcome of Extended Fisheries Jurisdiction as
one of unfulfilled promise. While landings increased enormously over the
period 1974-79, landings per fisherman showed, at best, a modest declining
trend in real terms over the same period (Roy 1988).That is, while landings
rose substantially, the number of fishermen rose even more, increasing
from under 13,000 in 1976 to 35,000 in 1980. As a result, the increased
landings made little impact on the real income of the average fisherman.
Overall, there is no noticeable trend in real landings per fisherman over
the broader period 1954-84, although it is notable that this value reached
a post-war peak in 1976, the year before Extended Fisheries Jurisdiction
was declared (Roy 1988).
This dismal scenario is, of course, consistent
with the proposition of long-run rent dissipation in an open-access fishery
(see, for example, Munro and Scott 1985). In fact, Extended Fisheries Jurisdiction
appears to have accelerated the process considerably, leading to such widespread
expectations of higher incomes in the fishery, that none of the participants
had the opportunity to earn such higher incomes, even temporarily. By the
time a freeze on personal fishing licences was finally introduced in 1980,
the damage had already been done (Schrank 1995).
Another factor was at work here, however.
Historically, since at least the middle of the nineteenth century, the
northern cod stock has sustained annual catches averaging no greater than
250,000 tonnes (Northern Cod Review Panel 1990, ch. 2). By 1959, this pattern
had been disrupted by a massive increase in foreign fishing effort, resulting
in catches which had peaked at a level of 783,000 tonnes in 1968. While
ICNAF began to impose TAC quotas in 1973, these were not set at levels
which were binding until 1977, by which time the bulk of the stock had
come under Canadian jurisdiction as a result of EFJ.
Canadian management policy since EFJ has
been based on the so-called F0.1 management rule (Gulland 1968),
which is more conservative than maximum sustainable yield (Canada Department
of Fisheries and Oceans 1981). The expectation was that after an initial
period of stock rebuilding, catches could be raised to (and indeed beyond)
historical levels (Munro 1980, ch. 3). For example, a Canadian government
document published in 1979 forecast a TAC of 402,000 tonnes for northern
cod by 1980 (Canada Department of Fisheries and Oceans 1979). Similar increases
were expected in other stocks.
Catches never came close to satisfying
these expectations. Particularly disappointing was the inshore catch, which
showed continuously declining catches through the early 1980's. As a result,
in 1987 the Minister of Fisheries commissioned a blue-ribbon group chaired
by Lee Alverson of the University of Washington to examine the question.
While the Task Group's report (Task Group on Newfoundland Inshore Fisheries
1987) was somewhat tentative in its observations, it did conclude that
the northern cod stock had not been regenerating as rapidly as what the
pre-1968 experience would have led one to expect (Task Group on Newfoundland
Inshore Fisheries 1987, 40).(10) It also
concluded that total allowable catches for northern cod had been set by
the Department of Fisheries and Oceans on the basis of an assumed fishing
mortality rate that the Task Group concluded had been consistently underestimated,
perhaps by a factor of 2 or more (Task Group on Newfoundland Inshore Fisheries
1987, 34-37).(11) This miscalculation may
have been a direct result of the underestimate of natural recruitment mentioned
above. This consistent pattern of underestimation has since been confirmed
both by the Canadian Atlantic Fisheries Scientific Advisory Committee (CAFSAC),
which was the body responsible for providing stock assessment advice to
the fisheries managers, and by the subsequent independent Northern Cod
Review Panel. In response, the TAC was reduced marginally from 266,000
tonnes in 1988 to 199,000 in 1990 (CAFSAC's advice(12)
having been a TAC of 125,000).
In retrospect, this response was too little
and too late (Schrank 1997). By 1992, the spawning stock biomass had fallen
into a range of 48,000-108,000 tonnes, the lowest value on record (Coady
1993). In July 1992 a moratorium on fishing the stock was declared. The
moratorium has since been extended to twelve other groundfish stocks. Prognosis
for northern cod is poor; the most recent stock status report(13)
finds that the stock is still at an extremely low level. Of particular
concern is the absence of any indication of good recruitment.
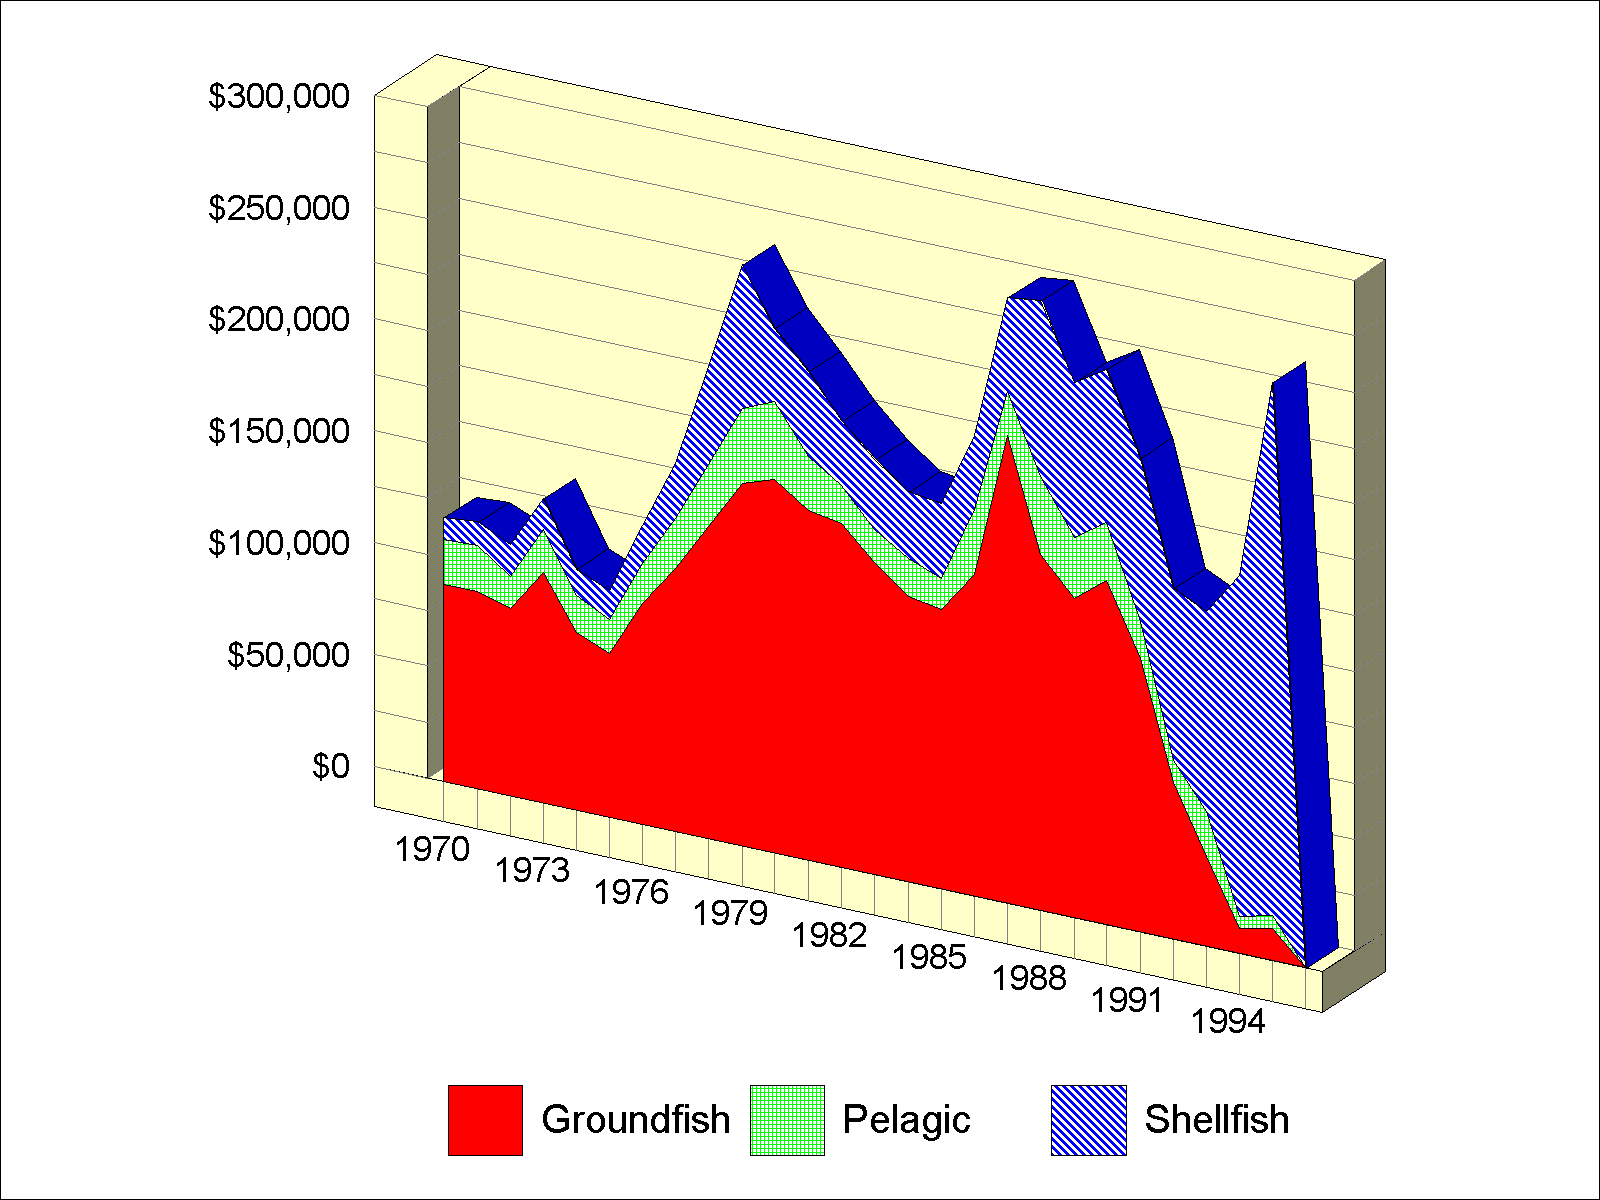
The effect of these events on the value
of fish landings in Newfoundland in real terms is presented in Figure
3. It can be seen that the value of groundfish landings reached its
peak in 1987, this peak due more to exceptionally high cod prices than
to particularly high landings per se. Over the period 1990-94, the
value of groundfish landings declined precipitously to about five percent
of this peak.
The changes that have taken place leave
us with a dilemma as to the period on which to focus in our analysis of
the Newfoundland fishery. It is our (perhaps optimistic) view that the
collapse of the groundfish stocks is a temporary phenomenon, and that the
fishery of the 1980's still has relevance. This relevance is reinforced
by the absence of any real structural change in the industry in response
to the current crisis (Schrank 1997). Other than the absence of finfish,
there is not much in the Newfoundland fishery that has really changed since
1987.
In the analysis below, we shall pay particular
attention to the state of the industry as of 1989, which in our view was
the last more-or-less normal year experienced by the Newfoundland fishery.
However, attention will also be paid to changes which have occurred since
that year which have some potential to become permanent.
The state of the resource stocks is described
in Section 2. The structure of the
harvesting and processing sectors is examined in Section
3. Government policies affecting the industry are analyzed in Section
4.
Table 3 presents
the breakdown of fish landings by species, both for our last 'normal' year
of 1989, and for 1995. In the former year, it is apparent that the Newfoundland
fishery was predominantly a groundfish fishery. The most important species
were cod (45%) and shrimp (17%), followed by plaice and greysole, capelin,
and lobster, each accounting for 7 percent.
By 1995, the groundfish stocks (except
for turbot) had collapsed, the capelin fishery was closed, and the fishery
was almost entirely dependent on a strengthened shrimp fishery (23%), along
with newly established or greatly expanded fisheries for clam (5%), scallop
(4%), and especially crab (50%). Only the lobster fishery was in the same
relative position as before.
The remainder of this section provides
a brief review of the state of the more important stocks utilized by the
Newfoundland fishery. Further details can be found in the DFO Atlantic
fisheries stock status report(14) for the
relevant stock, and (for groundfish) in the annual report of the independent
Fisheries Research Conservation Council, which is mandated to make recommendations
to the Minister on total allowable catches for Atlantic groundfish resources
(Canada Fisheries Resource Conservation Council 1996).
| Table
3
Value of Landings by Species Newfoundland, 1989 and 1995 (Preliminary) |
|||||
| 1989 | 1995p | ||||
| $,000 | % | $,000 | % | ||
| Total Landings | 266,357 | 100% | 339,678 | 100% | |
| Groundfish, Total | 155,460 | 58% | 18,384 | 5% | |
| Cod | 119,943 | 45% | 839 | 0% | |
| Plaice & Greysole | 19,639 | 7% | 1,126 | 0% | |
| Redfish | 4,734 | 2% | 1,824 | 1% | |
| Turbot | 7,613 | 3% | 12,595 | 4% | |
| Other | 3,531 | 1% | 2,000 | 1% | |
| Pelagic & Estuarial, Total | 30,140 | 11% | 7,353 | 2% | |
| Capelin | 19,101 | 7% | 44 | 0% | |
| Herring | 3,573 | 1% | 3,567 | 1% | |
| Salmon | 3,620 | 1% | 343 | 0% | |
| Other | 3,846 | 1% | 3,399 | 1% | |
| Molluscs & Crustaceans, Total | 75,484 | 28% | 304,103 | 90% | |
| Clams | 433 | 0% | 18,444 | 5% | |
| Lobster | 17,933 | 7% | 24,039 | 7% | |
| Scallops | 661 | 0% | 12,250 | 4% | |
| Crab | 10,304 | 4% | 171,521 | 50% | |
| Shrimp | 45,378 | 17% | 77,657 | 23% | |
| Other | 775 | 0% | 192 | 0% | |
| Miscellaneous Items | 5,311 | 2% | 9,838 | 3% | |
| Sources: Dept. of Fisheries and Oceans, Canadian Fisheries Annual Statistical Review, Volume 22, 1989, Table 28 (1989); Dept. of Fisheries and Oceans, Canadian Fisheries Landings, Vol 17(4), Dec. 1995, Table 5 (1995). | |||||
Cod. This species is managed as
six distinct stocks in the waters off Newfoundland. Three of these stocks
are of particular significance to the Newfoundland fishery, those located
in divisions 2J3KL, 3Ps, and 3PnRS respectively (Figure
4)(15).
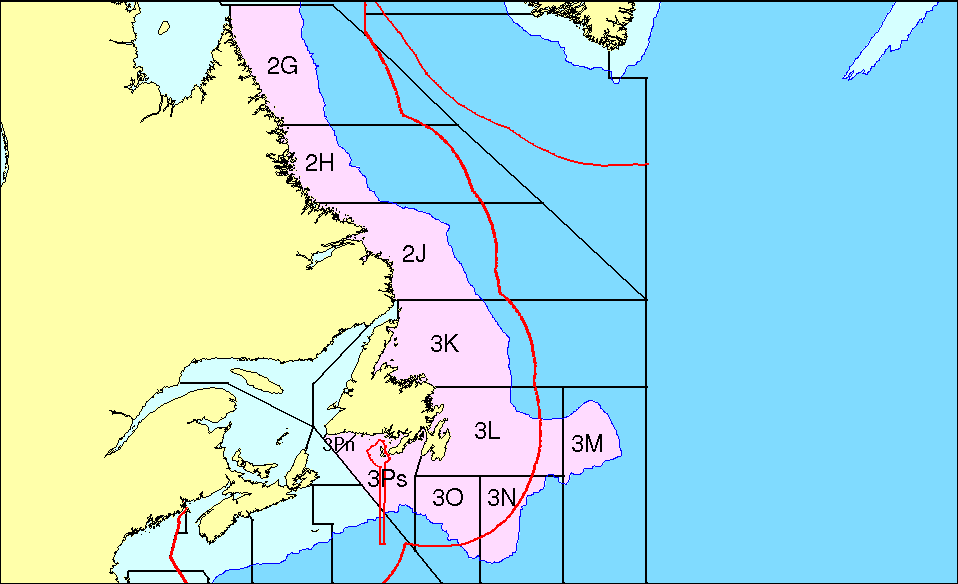
The 2J3KL (northern) cod stock, found along the northeast coast of Newfoundland and Labrador, has historically been the most important (1989 Canadian catch of 253 thousand tonnes). As discussed above, a moratorium on catches was imposed in 1992 and remains in effect. Spawning and total biomass is currently very low and recruitment is poor. Prognosis for this stock is poor. A part of this stock in division 3L lies outside the Canadian fishing zone (1989 foreign catch of 39 thousand tonnes) and is subject to regulation by the Northwest Atlantic Fisheries Organization (NAFO), the successor body to ICNAF.
The 3Ps (St. Pierre Bank) cod stock (1989
Canadian catch of 27 thousand tonnes) was closed in 1993 as a result of
low biomass estimates. The apparent presence of one strong (1989) and one
average (1990) year-class in this stock led to a limited (10,000 tonne)
fishery in 1997. Under the 1994 Canada-France Agreement, 15.6 percent of
the stock is shared with the French islands of St. Pierre and Miquelon.
Similarly, the 4RS3Pn (Gulf of St. Lawrence) cod stock (1989 Canadian catch
of 42 thousand tonnes) was closed in 1994, but despite low biomass and
weak recruitment, a limited (6,000 tonne) fishery was permitted in 1997.
These openings have not been without criticism, and indeed the 1996 DFO
Science overview document warns that "it will be necessary to have several
year-classes mature in order to successfully rebuild the spawning stock
biomasses and secure a potential sustainability for cod, flatfish, and
white hake. For these stocks it will take at least 7 to 12 years from the
time the strength of year classes increases before spawning stocks can
be expected to rebuild. . . . Re-opening the fisheries with the same sized
fleet and using the same management approaches or abusive fishing practices
as when the stocks declined would probably result in immediate overfishing."(16)
Plaice & Greysole. This category
encompasses a variety of species and stocks, of which the most important
to the Newfoundland fishery has historically been 3LNO Plaice (1989 Canadian
catch of 28 thousand tonnes). This stock is a straddling stock, subject
to NAFO regulation (1989 foreign catch of 13 thousand tonnes). As a result
of record low biomass and high juvenile mortality (the continental slope
outside the Canadian zone is a nursery area), a moratorium was put in place
in 1995. There is no sign of recruitment beyond the 1990 year-class. There
are eight additional stocks of plaice, yellowtail, and witch flounders
off Newfoundland, which together accounted for 20 thousand tonnes of Canadian
landings in 1989. All except two are currently subject to moratoria or
a no-directed-fishing regime.
Redfish. The most important stock,
Unit 1 Redfish (Gulf of St. Lawrence), was responsible for a 1989 Canadian
catch of 45 thousand tonnes. A moratorium was imposed in 1995 because of
very low biomass and no sign of incoming recruitment. The DFO Stock Status
Report indicates that recovery may occur in 7-9 years, but only after significant
recruitment has occurred. Unit 2 redfish (Laurentian Channel) shows no
sign of good recruitment subsequent to the 1988 year-class, but remains
open with a TAC of 10,000 tonnes, about the level of the 1989 catch. Other
redfish stocks in the area are mainly of interest to foreign harvesters.
Other groundfish. There appears
to be good recruitment in turbot. Since 1992 effort has been diverted to
species such as skate, monkfish, winter flounder, etc., which previously
were considered of minor importance. Little is known about the biology
of these stocks.
Capelin. This species is harvested
seasonally as it comes inshore to spawn (a directed foreign offshore fishery
was terminated in 1992). Capelin is a key element in the food chain of
cod, turbot, salmon, and marine mammals; as a result, it has purportedly
been managed conservatively on the basis that no more than 10 percent of
the projected mature biomass be removed annually in the commercial fishery.
While catches in 1994 and 1995 were poor, mainly because of small fish
size, the 1996 fishery caught 24 thousand tonnes in 2+3KL. This is about
equal to the historical average, but is far below the 80 thousand tonnes
caught in 1989 and 1990. The stock status report for 1996 reports the presence
of four abundant year-classes in 2+3KL.
Crab: Snow crab off Newfoundland
waters is managed as one stock, since there are no known barriers to larval
drift or other evidence to indicate distinct stocks. Landings are widely
distributed, but concentrated in NAFO divisions 3KL. Landings have increased
steadily since the late 1980's and reached a record high of almost 38,000
tonnes in 1996, more than double the historical peak in 1981, largely as
a result of expansion of the fishery to offshore areas. The crab fishery
is now Newfoundland's most valuable fishery. The most recent DFO Stock
Status Report expresses no major concerns regarding sustainability. The
total allowable catch was increased by 15 percent to 44,300 tonnes in 1997.
Shrimp. The northern shrimp stock,
harvested in NAFO divisions 0B through 3K, has grown from a level of 3,000
tonnes in 1984 to one in excess of 30,000 tonnes in 1996, with no signs
of stock depletion. Part of the reason for the expansion has been the discovery
of new fishing grounds in the area. There is also a mature shrimp fishery,
managed separately, in the Gulf of St. Lawrence, which the Newfoundland
fleet shares with adjacent provinces. This fishery has shown a stable pattern
of landings since the late 1980's. The Newfoundland fleet concentrates
its operations in the Esquiman channel (roughly Division 4R), which has
seen landings of around 5,000 tonnes since 1988.
In 1997 (a few weeks before a general election
was held), the TAC for northern shrimp was increased to 59,050 tonnes (from
37,600 in 1996). While there is no evidence of overfishing (yet), the most
recent DFO Stock Status Report on northern shrimp made the following observations:
The current high level of shrimp abundance
. . . is unprecedented in the Newfoundland-Labrador offshore area . . .
. Surveys of the early 1980's produced extremely low shrimp catches in
areas where abundance now is high. It is clear that the present environment
is favourable for shrimp survival. The absence of predators throughout
the region implies decreased natural mortality for shrimp and the cold
period from the late 1980's to the early 1990's might have contributed
positively to the survival of larvae.
An opportunity now exists to expand the
shrimp fishery substantially with a minimal risk of overexploitation. However,
beyond the next few years, it is not possible to predict how long high
abundance will last. Although water temperatures have moderated in the
past year or two, there is little indication that finfish abundance is
increasing. Recent conditions of low water temperature, reduced groundfish
abundance and healthy shellfish populations appear anomalous and a return
to more "normal" conditions at some time in the future is probable. Any
plan for expansion of the northern shrimp fishery will have to address
this possibility.(17)
There is no indication that the 1997 management
plan for the stock(18) has more than nominally
addressed this possibility. One can further question whether a TAC increase
of 57 percent in one year is consistent with the "precautionary approach"
that is supposed to newly inform Canadian fisheries management (Canada
Fisheries Research Conservation Council 1997), and which governs the UN
Agreement on the Conservation and Management of Straddling Fish Stocks,
which Canada played a significant role in negotiating.(19)
3.
Fishing and Fish Processing Industries
A heterogeneous fleet exists in Newfoundland
to harvest these stocks (Economic Council of Canada 1980, ch. 6). Customarily,
the fleet is divided into 'inshore' and 'offshore' vessels, with the dividing
line at 65 feet (or 19.8 meters) length overall.(20)
Generally speaking, an inshore fishing licence is issued in the name of
the individual fisher, who is required to fish the licence personally.
Corporations are not issued inshore licences.
The inshore fleet can usefully be categorized
into two components. There is a small-boat fleet consisting of generally
open vessels less than 35 feet (10.7 meters) long, which specialize in
cod and sometimes lobster and herring. There is also a fleet of decked
vessels, between 35 and 65 feet (10.7-19.8 meters) long, normally called
'longliners', although only a minority still use longlines extensively
as fishing gear. This sector, sometimes called the nearshore sector, is
a multispecies fleet active in catching cod, turbot, flatfish, capelin,
crab, shrimp and scallops.(21) Both sectors
use mainly fixed gear types such as traps, gillnets, longlines, and handlines,
although the larger longliners sometimes use mobile gear such as otter
trawls and Danish seines as well. Despite the 'nearshore' rubric, longliners
have been fishing increasingly further offshore, sometimes beyond the 200
mile limit, as inshore stocks have become further depleted. Both sectors
have become well equipped with electronic, communications, and hydraulic
gear (Program Coordination and Economics Branch 1993).
The 'offshore' sector likewise can be divided
into a small 'midshore' fleet of vessels between 65 and 100 feet (19.8-30.5
meters) long, and a much larger offshore trawler fleet of vessels in the
120-200 foot (36.6-61 meters) range, specializing in shrimp and groundfish.
The larger vessels are typically owned and operated by processing companies.
Table 4 outlines
the size distribution of registered (but not necessarily active)(22)
fishing vessels, and Table 5 the distribution of
landings by species and vessel length, for the year 1989. The former table
confirms the broad distribution of vessel sizes in the Newfoundland fleet,
with the exception of the 65-125 foot midshore range. The latter table
highlights the species dependence of the very small and very large boats,
and the species versatility of the nearshore fleet. It is clear from Table
5 that the groundfish moratoria of the 1990's were particularly devastating
to the small-boat and offshore fleets, which were the most dependent on
groundfish catches.
| Table
4
Number of Registered Fishing Vessels by Overall Length Newfoundland, 1989 |
|
| Length in Feet | Number |
| Under 35 (10.7 m.) | 15748 |
| 35 to 44.9 (10.7-13.7 m.) | 715 |
| 45 to 64.9 (13.7-19.79 m.) | 489 |
| 65 to 89.9 (19.8-27.4 m.) | 7 |
| 90 to 99.9 (27.4-30.5 m.) | 2 |
| 100 to 124.9 (30.5-38.1 m.) | 8 |
| 125 to 149.9 (38.1-45.7 m.) | 25 |
| 150 (45.7 m.) and over | 52 |
| Source: Department of Fisheries and Oceans, Canadian Fisheries Annual Statistical Review, Volume 22, Table 89. | |
| Table
5
Value of Catches by Vessel Length and Main Species Newfoundland, 1989 (in Millions of Dollars) |
|||||
| Species | Vessel Length | ||||
| < 35 ft. | 35-45 ft. | 45-65 ft. | 65-100 ft | > 100 ft. | |
| Groundfish | |||||
| Cod | 40.9 | 9.3 | 25.5 | 2.8 | 41.5 |
| Redfish | 0.2 | 0.9 | 3.6 | ||
| Turbot | 0.7 | 0.9 | 4.4 | 0.5 | 1.0 |
| Plaice & greysole | 1.6 | 1.3 | 2.3 | 0.1 | 14.3 |
| Total | 43.8 | 11.7 | 33.6 | 3.5 | 62.8 |
| Pelagics | |||||
| Herring | 0.5 | 0.2 | 1.2 | 0.8 | 0.9 |
| Salmon | 3.6 | ||||
| Capelin | 9.4 | 3.4 | 5.3 | 0.5 | 0.5 |
| Total | 14.2 | 3.9 | 8.4 | 1.4 | 2.2 |
| Molluscs & crustaceans | |||||
| Lobster | 17.8 | 0.1 | |||
| Shrimp | 4.6 | 40.7 | |||
| Crab | 0.4 | 1.4 | 8.5 | ||
| Total | 19.3 | 1.7 | 13.2 | 0.1 | 41.2 |
| Grand Total | 81.5 | 17.9 | 55.7 | 5.0 | 106.2 |
| Source:
Department of Fisheries and Oceans, Canadian Fisheries Annual Statistical
Review, volume 22 (Ottawa, 1996), Table 89.
Note: Columns may not sum to totals because miscellaneous categories are omitted. |
|||||
The tremendous expansion in the crab fishery
was of primary benefit to the nearshore fleet. However, in 1995 temporary
seasonal permits for inshore vessels (less than 35 feet in length) were
introduced. In 1996, 1,800 (out of a total 2,600) inshore vessels took
advantage of such permits. This sector has been assigned a quota of 5,895
tonnes (out of a TAC of 43,000 tonnes) for 1997.
The increase in shrimp landings has been
of primary benefit to the offshore fleet; up until now, the northern shrimp
stock (outside of the Gulf of St. Lawrence, which is separately managed)
has been exploited by about 12 large offshore trawlers.(23)
However, when the TAC was increased in 1997 from 37,600 to 59,050 tonnes,
Fisheries and Oceans announced that only 7,870 tonnes of the increase would
be allocated to existing licence holders. Of the remainder, 'priority access'
would be given to inshore vessels (less than 65 feet in length).
There has been a general long-term downward
trend in the number of registered vessels since 1980. The number of small
boats less than 35 feet fell from 18,197 to 13,588 in 1992; that of nearshore
vessels from 1,392 to 1,122; and that of offshore vessels from 116 to 77.
However, indications are that within these categories, vessels have
gotten larger. They certainly have become better equipped. Even open trap
skiffs in the small-boat fishery now possess hydraulic haulers, sounders,
and so on, enabling them to fish with fewer crew members and to fish more
gear (Program Coordination and Economics Branch 1993). It is generally
accepted that there was substantial excess harvesting capacity in the Newfoundland
fishery even before the moratorium, and may be up to two or three times
larger than is needed (Task Force on Incomes and Adjustment in the Atlantic
Fishery 1993, ch. 5; Canada Fisheries Resource Conservation Council 1997,
ch. 2).
Table 6 presents
the economic position of a random sample of full-time inshore enterprises
located in NAFO divisions 3K, 3L, and 3Ps. The returns, while positive,
are not high.(24) Moreover, it is likely
that the earnings reported are dominated by a small number of 'highliners'
in the fleet; most of the fishing enterprises are likely to be in a more
precarious position than is represented. The data on the length of the
fishing season is an indication of how seasonal fishing activity is in
the region.
This bleak picture is confirmed by the
results of an income survey of Atlantic fishermen taken in 1988, the results
of which are summarized in Table 7. The survey not
only reinforces the low level of incomes received, but indicates that even
for full-time fishermen, fishing income constitutes barely more than half
of income from all sources.
| Table
6
Economic Position of Average Full-Time Small-Boat and Nearshore Enterprise NAFO Divisions 3K, 3J, and 2Ps, 1989 |
||
| Small-Boat | Nearshore | |
| Fish sales | $16,168 | $74,872 |
| Labour share (deckhands) | $3,838 | $26,910 |
| Crew size (excluding skipper) | 1.0 | 2.6 |
| Average share per crew member | $3,838 | $10,350 |
| Gross return to owner and skipper (after depreciation) | $5,515 | $13,576 |
| Average investment (after grants) | $14,429 | $114,421 |
| Average days fished | 74.8 | 64.1 |
| Average weeks fished | 20.8 | 22.0 |
| Source: Department of Fisheries and Oceans, Cost and Earnings of Selected Inshore and Nearshore Enterprises in the Newfoundland Region 1989, Economic and Commercial Analysis Report No. 93 (St. John's, 1991). | ||
| Table
7
Income Sources, Active Fishermen by Registration Status Newfoundland, 1988 |
|||
| Full-Time | Part-Time | Average | |
| Net fishing income | $9,583 | $5,394 | $8,324 |
| Other employment income | $842 | $3,998 | $1,791 |
| Unemployment insurance | $6,132 | $4,009 | $5,493 |
| Other income | $508 | $901 | $627 |
| Total net income | $17,066 | $14,301 | $16,234 |
| Source: Department of Fisheries and Oceans, 1988 Survey of Atlantic Fishermen, Tables 3.19-3.21 (unpublished data). | |||
We will now outline the structure of the
processing sector. The predominant form of processing in Newfoundland is
primary freezing; 76 percent of the value of the product was processed
in this form in 1989.(25) There is a small
amount (7 percent) of product (mainly lobster, cod and salmon) which was
sold (perhaps minimally processed) in fresh form. Some cod was sold in
salted form, but this product appears to be a dying (if not dead) part
of the industry.
Most processing occurs onshore, although
northern shrimp is processed at sea. There were 256 registered fish processing
facilities in Newfoundland in 1989, ranging in size from "feeder" plants
employing a handful of people to process fish to the fillet skin-on stage,
to large year-round plants processing fish into various fresh and frozen
products including secondary processing. Very few operate on a full-time
basis (Moore et al.1993). The size and employment distribution of
the plants which were "operational" in 1990 is presented in Table
8.
| Table
8
Fish Processing Sector Employment by Plant Size Newfoundland, 1990 |
|||
| Plant Size
(No. of Employees) |
Number of Plants | Employment | |
| Average | Total | ||
| 1-49 | 101 | 19 | 1,919 |
| 50-99 | 40 | 65 | 2,600 |
| 100-249 | 52 | 148 | 7,696 |
| 250+ | 38 | 404 | 15,352 |
| Total | 231 | 119 | 27,567 |
| Source: Task Force on Incomes and Adjustment in the Atlantic Fishery, Charting a New Course (Ottawa, 1993), Appendix C, Table 9. | |||
Groundfish processing can be usefully categorized
into inshore and offshore facilities. The inshore sector is primarily supplied
by inshore vessels less than 65', although some supplementary supplies
from offshore trawlers act to extend the processing season. About 160 inshore
plants possess primary groundfish licences, although only 102 of these
have freezing capacity; the rest are presumably feeder plants or salt dryers.
The offshore plants, of which there were
11 in 1989, are primarily supplied by offshore trawlers. As a result, offshore
plants have an extended operating season (usually 40 weeks per year under
normal conditions). They are fully integrated enterprises with vessels
landing for particular plants. Only one of these plants (Burin) engages
in secondary processing. The throughput of these plants is typically supplemented
by inshore fish, and in addition, the offshore companies operate inshore
plants that are fully supplied by independent inshore harvesters. Other
inshore plants are owned by single-facility operators, or by medium-size
companies that may own two or three plants. The largest offshore company
in Newfoundland is Fishery Products International of St. John's, which
owned nine of the offshore plants. Also participating in this sector are
National Sea Products, whose activities center in Nova Scotia but with
some Newfoundland activity, and more recently the much smaller Seafreez
Corporation.(26)
Fishermen on offshore vessels are not employees
in the strict legal sense; they maintain some independence of action, though
less now than in earlier years. They are co-adventurers sharing in the
value of the catch according to a "lay arrangement" negotiated with the
fisherman's union. Prior to the early 1980's, the vessel captain enjoyed
considerable freedom in deciding where to fish and for what species. With
the introduction of Enterprise Allocations in 1982 (see section 4 below),
and a much greater emphasis on fishing to meet market requirements, rather
than for volume alone, the companies now exercise much greater control
in directing their vessels' fishing effort (Gardner Pinfold 1989).
The inshore sector is highly seasonal,
with facilities typically utilized for only 12-15 weeks. There has been
an active policy of fleet separation in the inshore sector where processing
companies cannot acquire new fishing licences, although existing licences
are grandfathered (Canada Department of Fisheries and Oceans 1996, section
15). In practice this constraint has been overcome by plants establishing
strong, yet informal relationships with harvesters that result in vessels
committing to landing for that facility on an ongoing basis (Moore et
al. 1993; Gardner Pinfold 1989). Such arrangements involve a variety
of legal and quasi-legal financial linkages, including outfitting assistance,
working capital loans or direct investment in a vessel where the processing
company is effectively a "silent partner" in the harvesting enterprise
(Canning and Pitt 1993). While usually there is only one buyer in a fishing
port, his bargaining power is considerably weakened by the existence of
significant overcapacity in the processing sector, and the resultant shore
competition for resources, as well as the presence of a strong union which
negotiates minimum prices at the beginning of the season (Gardner Pinfold
1989).
As for other species, capelin is an important
species to Newfoundland inshore processors where the roe-present females
are sorted and frozen for the Japanese market. The fishery is concentrated
at the time of spawning, usually in a short interval in June, and generates
significant production revenues ($37 million in 1989). Significant quantities
of capelin are trucked around the island for processing as plants are anxious
to share in the high margins usually afforded this fishery. Crab production
has been dominated in recent years by the production of IQF sections for
the lucrative Japanese market, a move away from frozen meat production.
Northern shrimp (not including the Gulf of St. Lawrence stock) is processed
at sea as either cooked product or in the shell-on form. The smallest or
"industrial" shrimp is frozen in bulk for processing on shore. Lobster
is typically sold live to the United States and European markets (Moore
et al. 1993).
Despite the existence of a purported freeze
in primary processing licences at the provincial level (Kingsley 1993),
the number of registered plants increased from 214 in 1980 to a peak of
281 in 1991, although much of this increase has been for new species and
product forms (Moore et al. 1993).(27)
There is a general consensus that the degree of excess capacity in the
processing sector exceeds fifty percent (Task Force on Incomes and Adjustment
in the Atlantic Fishery 1993), and numbers as low as 17 percent have been
reported for the inshore sector (Kingsley 1993). It is widely anticipated
that half of the existing plants will remain closed when the groundfish
moratorium is lifted. Only two offshore plants are presently operating,
and four have been closed permanently.
4. Government Policies
Commercial fishermen have been required
to register as such with the Department of Fisheries and Oceans on an annual
basis. Registration in Newfoundland used to be characterized by a differentiation
between full-time and part-time fishermen (Canada Department of Fisheries
and Oceans 1989, ch. 2). Generally, full-time status was required to obtain
new or transferred licences in limited-entry fisheries. In 1989, 14,052
fishermen were registered as full-time, and 15,124 as part-time in Newfoundland.
While most of the full-time fishermen were active participants in the fishery
(since failure to fish on a full-time basis for two consecutive years could
result in the loss of full-time status), a substantial portion of the part-time
fishermen were not.(28)
The differentiation between full-time and
part-time fishermen was intended to reflect a distinction between those
who had a fundamental commitment to, and dependence on, the industry, and
those who did not, without interfering with the historical common-law right
to fish in tidal waters -- a right which, in English-speaking countries,
goes back to the Magna Carta (Sutherland 1990). Unfortunately, the
distinction failed to produce the desired results. The Cashin Task Force
observed:
Registration as a part-time fisherman is
open to almost anyone who wants it. Anyone who works as crew or as a part-time
fisherman during two consecutive years can seek registration as a full-time
fisherman, and will receive that status almost automatically (Task Force
on Incomes and Adjustment in the Atlantic Fishery 1993, p.61).
In fact, over the period 1986-92, on average
there were 3,050 new entrants (part-time fishermen) registered annually
in Newfoundland. An average of 645 part-time fishermen were upgraded to
full-time status annually (Donahue 1993).(29)
As a result of these deficiencies, in 1996
fisher registration was eliminated and replaced by a system of enterprise
registration. The centerpiece of the new system is the definition of a
"core" group of inshore enterprises. The head of a core enterprise is required
to hold key species licences, have an attachment to the fishery, and be
dependent on the fishery. Only core enterprises are able to obtain new
or re-issued vessel-based inshore licences, or (for the most part) to split
existing licences. Entry into the core is possible only by certified professional
fishers,(30) and only by replacing an existing
enterprise; thus, at least in principle the number of core enterprises
is capped (Canada Department of Fisheries and Oceans 1996, ch. 3). Non-core
enterprises can continue to use their existing licences, but these can
be transferred (technically, re-issued) only to a core enterprise. Thus,
the number of non-core enterprises will be subject to gradual attrition.
In Newfoundland, approximately 5,400 enterprises have qualified for core
status.(31)
All vessels used in a commercial fishery
must be registered with Department of Fisheries and Oceans in the name
of the fisher holding the licence for that fishery. With very limited exceptions,(32)
the number of registered vessels in Newfoundland is frozen, reflecting
the general perception that the fleet is severely overcapialized. A vessel
registration held by a non-core enterprise may be transferred ("re-issued"),
but only to a core enterprise (Canada Department of Fisheries and Oceans
1996, section 12). Non-core enterprises may not replace a registered vessel
with one which is larger than the one being replaced. Core enterprises
are subject to replacement rules that are a little more flexible (Canada
Department of Fisheries and Oceans 1996, section 24), particularly if the
vessel is being utilized entirely in fisheries subject to individual quotas
(or if a fisher in a competitive fishery agrees to individual harvest restrictions
in order to qualify for such eased replacement rules).(33)
At present, fishing for all commercially
significant species in Newfoundland is subject to limited-entry licensing
by the Department of Fisheries and Oceans.(34)
Generally, an inshore fishing licence specifies the species to be fished
(although the groundfish licence is not otherwise species-specific), the
name of the fisher who can use the licence and of the vessel on which it
can be used, the area in which it can be used, and the number and types
of gear that can be used. It may also specify the volume permitted to be
taken, the period during which fishing can occur, the specific location
for the setting of gear, the location, times, and methods by which the
catch is landed, and the provision of detailed harvesting information and
records including verification by an observer.(35)
An inshore licence must be used personally
by the person to whom it is issued, and must be renewed annually. An inshore
fisher cannot hold more than one licence for the same species; that is,
he cannot "stack" licenses with different conditions (however, a licence
may be validated for more than one gear type) (Canada Department of Fisheries
and Oceans 1996, section 11).
Government licence policy is explicit as
to whether a fishing license can be sold or otherwise transferred to another
fisher.
A "licence" grants permission to do something
which, without such permission, would be prohibited. As such, a licence
confers no property or other rights that can be legally sold, bartered
or bequeathed. Essentially, it is a privilege to do something, subject
to the terms and conditions of the licence. . . . A "fishing licence" is
an instrument by which the Minister of Fisheries and Oceans, pursuant to
his discretionary authority under the Fisheries Act, grants permission
to a person including an Aboriginal organization to harvest certain species
of fish or marine plants subject to the conditions attached to the licence.
This is in no sense a permanent permission; it terminates upon expiry of
the licence. The licensee is essentially given a limited fishing privilege
rather than any kind absolute or permanent "right or property" (Canada
Department of Fisheries and Oceans 1996, section 5).
Notwithstanding this statutory prohibition,
the Department will generally permit a licence holder to "recommend" an
eligible fisher (who must however be the head of a core enterprise, and
otherwise satisfy the conditions of the licence) for a replacement licence
when a fishing licence is to be relinquished (the Department avoids the
use of the term "transfer" for this operation, and instead uses the word
"re-issue") (Canada Department of Fisheries and Oceans 1996, section 16).(36)
As a result, an informal trade has developed in limited-entry licences
(Task Force on Incomes and Adjustment in the Atlantic Fishery 1993, 62).
Crowley and Palsson (1992) report values, obtained from various informal
sources, of $8,000-12,000 for the sale of capelin licences, $10,000-100,000
for inshore groundfish licences, $40,000-100,000 for crab licences, and
$100,000 for offshore tuna licences.
The number of licences issued for the commercially
important species is presented in Table 9. The general
trend has been for the number of licences to increase in the 1980's. For
some species, the number of licences has declined marginally since then.(37)
However, the tremendous expansion in crab catches has caused a free-for-all
in crab licences. Until 1985, the number of crab licences was tightly controlled
at 52. In that year, a new "supplementary" crab fishery was established
in divisions 2J, 3K, and 3Ps (and extended to 3L in 1988). The supplementary
fishery established separate quotas, smaller trap limits, and shorter seasons
than the existing "full-time" fishery. Access to the new fishery was open
to full-time fixed-gear groundfish fishermen operating nearshore (35-65
foot) vessels. As a result, the process of acquiring larger vessels was
accelerated, particularly in division 3K. The number of supplementary licences
increased from 74 in 1985 to over 700 by 1996. In 1995, "temporary" seasonal
permits, with relatively modest quotas and trap limits, were introduced.
All core enterprises with vessels under 35 feet are eligible to apply for
a seasonal permit. In 1996, approximately 1,800 did so. Currently 2,600
enterprises hold snow crab licences in some form.
| Table
9
Number of Fishing Licences Issued by Type Newfoundland, Selected Years |
|||
| 1984 | 1989 | 1992 | |
| Groundfish | 9,994 | 9,820 | 9,210 |
| Herring | 855 | 3,308 | 3,104 |
| Mackerel | 415 | 836 | 896 |
| Tuna | 0 | 29 | 55 |
| Salmon | 4,708 | 3,101 | 320 |
| Capelin | 959 | 3,140 | 3,087 |
| Scallop | 606 | 700 | 803 |
| Lobster | 4,162 | 4,508 | 4,375 |
| Shrimp | 41 | 64 | 64 |
| Crab | 52 | 688 | 750 |
| Sources: Dept. of Fisheries and Oceans, Canadian Fisheries Annual Statistical Review; Donahue 1993, Appendix III. | |||
Table 10 lists
the fisheries in Newfoundland waters that are subject to individual quotas.
Comparison with Tables 3 and 5
above suggest that the offshore fleet is subject to virtually 100 percent
coverage, and that overall about 80 percent of landings are currently subject
to individual quotas. Normally, the quota is stated as a given percentage
of the total allowable catch, although in the case of tuna, crab, and northern
shrimp the quota is expressed in terms of tonnage. Offshore quotas are
assigned to the enterprise rather than the vessel (and so is called an
Enterprise Allocation (EA) as a result). Companies are free to allocate
their EA's among their vessels and plants as they see fit. Because of the
fleet separation policy of the Department of Fisheries and Oceans', the
distinction between vessel and enterprise is moot for the inshore sector.
| Table
10
Individual Quota Fisheries, Newfoundland, by Date of Introduction |
|
| Fishery | Date of Introduction |
| Offshore (>100') groundfish | 1982 |
| Purse seine herring (4RTVnWX) | 1983 |
| Mobile gear groundfish, 45-65' (4RST3Pn) | 1983 |
| Offshore tuna | 1987 |
| Northern shrimp | 1987 |
| Midshore (65-100') groundfish | 1988 |
| Snow crab | 1995, 1996 |
| Sources: Sutherland 1990; Crowley and Palsson 1993; Donahue 1993; Grafton 1996; Department of Fisheries and Oceans, Newfoundland Region, 1997 Stock Status Report Newfoundland and Labrador Snow Crab (Stock Status Report #C2-01). | |
Individual quotas are implemented as a
condition on the fishing licence. As a result, quota cannot be transferred
(or "re-issued") unless the entire licence is. Because an inshore enterprise
cannot hold more than one licence for a given species, such enterprises
cannot accumulate quota by acquiring the licences of other enterprises.
Thus, individual quotas rank low in both transferability and divisibility.
In practice, Department officials are fairly flexible in permitting temporary
transfers of quota on a seasonal basis (Sutherland 1990; Grafton 1996).
However, permanent transfers, while not unheard of, can take place only
outside of the framework of DFO licencing policy (Canada Department of
Fisheries and Oceans 1996), and so require the explicit agreement of the
Minister of Fisheries "in his absolute discretion."(38)
What is the prognosis for IQ's in the remainder
of the Newfoundland fishery? A DFO working group in 1990 assessed each
fishery in the Atlantic coast as to its suitability for IQ management,
and its assessments are presented in Table 11 below.
Notably, the main reason for rejecting a fishery for individual quota management
was that there were "too many participants" in the fishery. Since then,
an IQ system has been introduced into the snow crab fishery which has 2,600
vessels, with no apparent problems (at least related to the number of participants).(39)
Admittedly, the limited number of marketing channels available for this
product makes a system of dockside monitoring (importantly, one designed
and managed by the fishers themselves) fairly easy to administer. Still,
it is probable that the apparent success of the program will lead to a
reassessment of the importance of numbers to the success of an IQ system.
| Table
11
Commercial Fisheries Candidates for IQ Management Newfoundland, 1990 |
||
| Fishery | Assessment | Comment |
| Groundfish, fixed gear | No | Too many participants |
| Groundfish, <65', mobile gear, Nfld. Region | Yes | |
| Capelin, fixed gear, <65' | No | Too many participants |
| Capelin, mobile gear, <65' | Yes | |
| Salmon | No | Too many participantsa/No TAC |
| Herring, fixed gear, <65' | No | Too many participants |
| Herring, mobile gear, <65', Nfld. Region | Maybe | |
| Char | No | No TAC |
| Swordfish | Yes | |
| Lobster | No | Current management regime satisfactory |
| Scallops, Nfld. Region | No | No TACb |
| Scallops, 4R3Pn | No | Too many participants |
| Shrimp, 4R | Yes | |
| Source:
Sutherland 1990, chapter 4.
aThis fishery was subject to a licence retirement program in 1992. bThe 3Ps stock is now mainly under French jurisdiction as a consequence of the delineation of the Exclusive Economic Zone for St. Pierre-Miquelon by the World Court in 1992. A newly discovered stock in division 3LN was subjected to TAC's beginning in 1995. |
||
Government expenditure on behalf of the
Newfoundland fishery is substantial, and defies easy summarization (Schrank
et al.1995). Table 12 outlines the structure
of government expenditure during fiscal year 1989, our benchmark year.
Total expenditures by the federal and provincial and provincial governments
equaled $401 million in net terms (that is, after deducting premiums, charges,
licencing revenues, loan repayments, and so on obtained from the industry).
By way of comparison, in the same year, the industry was responsible for
$266 million in landings, and produced $722 million in final product.
| Table
12
Government Net Financial Outlays on the Newfoundland Fishery, by Level of Government 1989/90, in Millions of Dollars |
|||
| Type of Expenditure | Federal | Provincial | Total |
| Net expenditure on goods and services | $93 | $22 | $115 |
| Net transfer payments | $248 | $16 | $264 |
| Net loans | $3 | $19 | $22 |
| Total | $344 | $57 | $401 |
| Source: Schrank et al. 1995, Table 3. | |||
Clearly, the most important category here
is that of federal government transfer payments; of these, the most significant
are those made under the unemployment insurance program. There are two
types of unemployment insurance payments: regular benefits and fishermen's
benefits. For most of the 1980's, only 10 weeks of employment in a year
were required in order to qualify for regular benefits (in a high-unemployment
area such as Newfoundland). Once she had qualified for regular benefits,
a worker was eligible for up to 50 weeks of benefits (in a high unemployment
area), at a rate equal to sixty percent of her average weekly earnings
during the qualifying period. Fishers who did not obtain ten weeks of regular
employment, were able to use fishing as qualifying employment for fishermen's
benefits,(40) and so were able to enjoy
such benefits for up to 27 weeks during their off-season (Roy et al.1994;
Roy forthcoming). This expenditure must be considered a cross-subsidy,
because while the unemployment insurance program is self-financing overall,
the fishing industry receives far more in benefits than it pays in premiums
-- for example, $105 million in excess of contributions were paid out to
fishermen, and $123 million to fish plant workers, in fiscal 1989 (Schrank
et al.1995, Table 6).(41)
While unemployment insurance was the most
important transfer element, fishing vessel subsidies of approximately $12
million, evenly divided between the two levels of government, were also
recorded. Plant subsidies of various kinds amounted to $6 million at the
federal level and $10 million at the provincial level. Various job creation
programs on the part of the Canada Employment and Immigration Commission
amounted to another $7.3 million. Of the expenditure on goods and services
reported in Table 12, social overhead (infrastructure)
expenditures (wharves, breakwaters, etc.) were the most important, amounting
to $17 million at the federal level and $8 million at the provincial level.
The most important of the loan expenditures was the operations of the provincial
Fisheries Loan Board, which was responsible for $4.5 million in net loans
to fishermen. However, various other provincial government loans amounted
to $1.9 million on fishing vessels and $11.9 million to processing plants
(Schrank et al.1995, Appendix 4). All this, in a 'normal' year.(42)
It will come as no surprise that the recent
groundfish crisis has substantially increased the amount of government
financial involvement in the industry. This increased involvement was channeled
through three federal government programs -- the Atlantic Fisheries Adjustment
Program (AFAP), the Northern Cod Adjustment and Recovery Program (NCARP),
and The Atlantic Groundfish Strategy (TAGS).
The Atlantic Fisheries Adjustment Program
was initiated in 1990 in response to the report of the Northern Cod Review
Panel. A sum of $604 million was allocated over an eight year period. By
fiscal 1993, two-thirds of the funds had been spent, about 70 percent in
Newfoundland. Objectives of the program were rebuilding the fish stocks,
short- and long-term "adjustment", and economic diversification both within
and outside the fisheries. While a modest number of new jobs were created,
the program was quickly overtaken by events. Schrank (1997, 52) evaluates
AFAP as "an anemic response to a major catastrophe, the scope of which
was still not understood at the time the program was established."
The Northern Cod Adjustment and Recovery
Program was a two-year program instituted in 1992 as a result of the moratorium
on the northern cod stock. The program had two broad purposes. The first
was income support for the fishers and fish plant workers who had been
displaced by the moratorium. Approximately 16,000 plant workers (6,000
more than expected) and 9,000 fishers (most in Newfoundland, but some in
Nova Scotia) were impacted by this aspect of the program, which eventually
cost $484 million. The second purpose was economic adjustment, which included
provisions for retraining, early retirement and licence retirement. This
part of the program was dramatically undersubscribed; of the $163 million
allocated by the federal government, only a little over $100 million was
spent. In fact, only 1,436 fishers and plant workers took early retirement,
and only 876 fishers retired their groundfish licences (Schrank 1997).
The $1.9 billion TAGS program was introduced in 1994 as a result of the failure of the northern cod stocks to recover before the expiry of NCARP, and the extension of the crisis to most of the remaining groundfish stocks in the Atlantic region. As with NCARP, the program had both income support and economic adjustment components. Unlike NCARP, the program had an explicit adjustment objective: a fifty percent reduction in capacity in the industry. As with NCARP, the income support component of the program was oversubscribed, attracting over 40,000 applicants (24,000 in Newfoundland) instead of the expected 26,500. As a result, the government reallocated funds from the income adjustment part of the program (which, as with NCARP, was undersubscribed(43)), and announced that the income maintenance program would terminate a year early, in 1998. Once more, a program with both income support and economic adjustment objectives ended up producing considerable income maintenance, and almost no economic adjustment (Schrank 1997).
Anderson, Lee G. 1994. Highgrading in ITQ fisheries. Marine Resource Economics 9(3):209-226.
Arnarson, Ragnar. 1994. On catch discarding in fisheries. Marine Resource Economics 9(3):189-208
Canada. Department of Fisheries and Oceans. 1979. Resource prospects for Canada's Atlantic coast fisheries 1979-1985.
------ . 1981. Resource prospects for Canada's Atlantic coast fisheries 1981-1987.
------. 1989. Commercial fisheries licensing policy for Eastern Canada January 1989.
------. 1996. Commercial fisheries licensing policy for Eastern Canada. Online. Internet. August 1997. Available HTTP: www.ncr.dfo.ca/communic/lic_pol/index_e.htm
------. Fisheries Resource Conservation Council. 1996. Building the bridge. Report FRCC.96.R.2. Online. Internet. August 1997. Available HTTP: www.ncr.dfo.ca/frcc/fisheries/index.html.
------. 1997. A groundfish conservation framework for Atlantic Canada. Report FRCC.97.R.3.
Canning & Pitt Associates. 1993. Access and allocation -- issues and principles: an industry perspective. Ottawa: Department of Fisheries and Oceans.
Carew, Kenneth. 1987. Utilization of inshore and nearshore fishing vessels in the Newfoundland Region, 1985. St. John's: Program Coordination and Economics Branch, Department of Fisheries and Oceans.
Coady, Larry. 1993. Groundfish resource crisis: ecological and other perspectives on the Newfoundland fishery. In The Newfoundland groundfish fisheries: defining the reality, ed. K. Storey. St. John's: Institute of Social and Economic Research, Memorial University of Newfoundland.
Copes, Parzival. 1970. The role of the fishing industry in the economic development of Newfoundland. Seattle: University of Washington Press.
Crowley, R.W., and H. Palsson. 1992. Rights based fisheries management in Canada. Marine Resource Economics 7(2):1-21.
Donahue, Brian. 1993. Fisheries access: licensing and registrations -- policy and statistical review 1977-1992. Ottawa: Department of Fisheries and Oceans.
Economic Council of Canada. 1980. Newfoundland from dependency to self- reliance. Ottawa: Supply and Services Canada.
Gardner Pinfold Consulting Economists. 1989. An analysis of price formation in port markets in Atlantic Canada. Economic and Commercial Analysis Report No. 3. Ottawa: Department of Fisheries and Oceans.
Grafton, R. Quentin. 1996. Performance of and prospects for rights-based fisheries management in Atlantic Canada. In Taking ownership: property rights and fishery management on the Atlantic Coast, ed. B.L. Crowley, 145-182. Halifax: Atlantic Institute for Market Studies.
Gulland, John A. 1968. The concept of marginal yield from exploited fish stocks. Journal de conseil international de l'exploration de la mer 32:256-261.
Innis, Harold A. 1978. The cod fisheries: the history of an international economy. Toronto: University of Toronto Press.
Kingsley, R.G. 1993. Overview of the Newfoundland and Labrador groundfish processing industry. In The Newfoundland groundfish fisheries: defining the reality, ed. K. Storey. St. John's: Institute of Social and Economic Research, Memorial University of Newfoundland.
Moore, W.P., Debora Walsh, Iona Worden, and J.D. MacDonald. 1993. The fish processing sector in Atlantic Canada: industry trends and dynamics. Ottawa: Department of Fisheries and Oceans.
Munro, Gordon. 1980. A promise of abundance: Extended Fisheries Jurisdiction and the Newfoundland Economy. Ottawa: Supply and Services Canada.
------. 1988. International co-operation for resource management: fisheries. Discussion Paper no. 88-08. Vancouver: Department of Economics, University of British Columbia, 1988.
Munro, Gordon, and Anthony Scott. 1985. The economics of fisheries management. In Handbook of natural resource and energy economics, ed. A.V. Kneese and J.L. Sweeney, vol. II, 623-76. Amsterdam: North Holland.
Northern Cod Review Panel. 1990. Independent review of the state of the northern cod stock. Ottawa: Department of Fisheries and Oceans.
Program Coordination and Economics Branch, Department of Fisheries and Oceans, Newfoundland Region. 1993. Profile of harvesting capacity in the Newfoundland Region. In The Newfoundland groundfish fisheries: defining the reality, ed. K. Storey. St. John's: Institute of Social and Economic Research, Memorial University of Newfoundland.
Roy, Noel. 1988. The role of the fishery in the Newfoundland economy. Paper presented to Atlantic Canada Faculty Institute, Canadian-American Center, University of Maine, June 14, 1988, at St. John's, Newfoundland.
------. 1996. What went wrong and what can we learn from it? In Fisheries and uncertainty: a precautionary approach to resource management, ed. G. Munro and D. Gordon, 15-25. Calgary: University of Calgary Press.
------. Forthcoming. The impact of social insurance on the length of the fishing season. In Proceedings of the eighth biennial conference of the International Institute for Fisheries Economics and Trade. Marrakech, Morocco: Office National des Pêches. Online. Internet. August 1997. Available HTTP: www.ucs.mun.ca/~noelroy/impact.html.
Roy, Noel, Leigh Mazany, Eugene Tsoa, and William E. Schrank. 1994. Unemployment insurance and the length of the fishing season. In Proceedings of the sixth biennial conference of the International Institute of Fisheries Economics and Trade, ed. M. Antona, J. Catazano, and J.C. Sutinen, 693-713. Issy-les-Moulineaux, France: Institut Français de Recherche pour l'Exploitation de la Mer.
Roy, Noel, William E. Schrank, and Eugene Tsoa. 1982. The Newfoundland groundfishery: some options for renewal. Canadian Public Policy VIII(2):222-238.
Schrank, William E. 1995. Extended Fisheries Jurisdiction: origins of the current crisis in Atlantic Canada's fisheries. Marine Policy 19(4):285-299.
------. 1997. The Newfoundland fishery: past, present, and future. Subsidies and depletion of world fisheries: case studies, 35-70. Washington: World Wildlife Fund.
Schrank, William, Rosemary Ommer, Noel Roy and Blanca Skoda. 1992. An inshore fishery: a commercially viable industry or an employer of last resort. Ocean Development and International Law 23(4):335-367.
Schrank, William, Blanca Skoda, Paul Parsons, and Noel Roy. 1995. The cost to government of maintaining a commercially viable fishery: the case of Newfoundland, 1981/82 to 1990/91. Ocean Development and International Law 26(4):357-390.
Schrank, William, Blanca Skoda, Noel Roy and Eugene Tsoa. 1987. Canadian government financial involvement in a marine fishery: the case of Newfoundland, 1972/73-1980-81. Ocean Development and International Law 18(5):533-84.
Sutherland, Paul. 1990. Individual quota management in Canadian fisheries: taking stock and future directions. A report prepared by a DFO Working Group. Ottawa: Department of Fisheries and Oceans. Typescript.
Task Force on Incomes and Adjustment in the Atlantic Fishery. 1993. Charting a new course: towards the fishery of the future. Ottawa: Department of Fisheries and Oceans.
Task Group on Newfoundland Inshore Fisheries. 1987. A study of trends of cod stocks off Newfoundland and factors influencing their abundance and availability to the inshore fishery. Ottawa: Department of Fisheries and Oceans. Typescript.
2. The Canadian dollar was worth about US$0.74 in 1996.
3. Newfoundland and Labrador, Historical Statistics of Newfoundland and Labrador (St. John's: Department of Public Works and Services, 1994), volume II(VII), Table K-7.
4. According to the D.F.O. 1988 Survey of Atlantic Fishermen, 88 percent of fishermen in Newfoundland with full-time registration were engaged in fishing activity in that year, as opposed to only 37 percent of fishermen registered as part-time. 1988 Survey of Atlantic Fishermen, Table 3.1.
5. Task Force on Incomes and Adjustment in the Atlantic Fishery 1993, Tables 9 and 16.
6. Statistics Canada, Food Industries, cat. no. 32-250, as reported in Historical Statistics of Newfoundland and Labrador, Volume II(VII), Table N-3.
7. This trend is exaggerated somewhat by a data redefinition in 1984 which had the effect of increasing the share of the services sector in that year by four percentage points. Nonetheless, the trend to an enlarged services sector is apparent in the series both preceding and following this data break.
8. Statistics Canada, Provincial Economic Accounts, Cat. No. 13-213.
9. While the convention was concluded in 1982, that part of the convention which pertained to fisheries (Part V) had been agreed to by 1975. This part of the convention had become generally regarded as part of customary international law, and had been formally recognized as such by the International Court of Justice (Munro 1988). Ironically, Canada has yet to ratify the convention, apparently out of concerns that such ratification would limit Canada's ability to protect its extra-territorial interests under other aspects of international law.
10. One may speculate that the extremely heavy exploitation of the stock by the distant water nations in the period 1959-1976 caused a significant departure from stock-recruitment relations appropriate to more typical conditions. The Task Group Report hints at such a departure, and then rather pointedly (and uncharacteristically) suggests "that it would be irresponsible not to take the possibility into account in setting management measures" (emphasis in original).
11. In the period immediately after EFJ, total allowable catches were set to achieve a fishing mortality rate (catch as a proportion of stock biomass) of 0.16, and later 0.2. In fact, the actual rate appears to have been around 0.5 (Task Group on Newfoundland Inshore Fisheries 1987, Table 4). Unfortunately, in subsequent years the discrepancy actually widened, to a level which by some calculations exceeded 1.0 (Roy 1996).
12. Canadian Atlantic Fisheries Scientific Advisory Committee, Advice for 1989 in the Management of Cod in Division 2J3KL. CAFSAC Advisory Document 89/1 (Ottawa, 1989).
13. Department of Fisheries and Oceans, Stock Status Report. Cod: southern Labrador and northern Grand Banks (2J+3KL). DFO Atlantic Fisheries Stock Status Report 96/45 (Ottawa, 1996). Online. Internet. August 1997. Available HTTP: csas.meds.dfo.ca/csas/STATUS/1996/96_045e.htm.
14. At time of writing (August 1997), the full set of stock status reports for 1996 were available on-line at http://csas.meds.dfo.ca/csas/STATUS/1996/Lst_ssre.htm.
15. However, these distinctions are somewhat arbitrary. On the one hand, there is some mixing between these stocks; for example, the 3Ps stock is seasonally augmented by migration from 3Pn and 3L. On the other hand, these stocks typically consist of several sub-stocks, with distinct spawning sites and migration patterns. Overfishing a substock may result in a reduction in the genetic diversity of the population (Canada Fisheries Resource Conservation Council 1997).
16. Department of Fisheries and Oceans, Overview of the Status of Canadian Managed Groundfish Stocks in the Gulf of St. Lawrence and in the Canadian Atlantic, DFO Atlantic Fisheries Stock Status Report 96/40 (Ottawa, 1996).
17. Department of Fisheries and Oceans, Northern Shrimp off Newfoundland and Labrador, DFO Science Stock Status Report # C2-05 (Ottawa, 1997). Online. Internet. August 1997. Available HTTP: csas.meds.dfo.ca/csas/STATUS/1997/c2-05e.pdf.
18. Department of Fisheries and Oceans, Northern Shrimp, Backgrounder B-HQ-97-24 ( Ottawa, 1997). Online. Internet.August 1997. Available HTTP: www.ncr.dfo.ca/communic/backgrou/1997/hq24e1.htm.
19. United Nations, Draft Agreement For the Implementation of the Provisions of the United Nations Convention on the Law of the Sea of 10 December 1982 Relating to the Conservation and Management of Straddling Fish Stocks and Highly Migratory Fish Stocks, Document No. A/CONF.164/33 (New York, 1995), Article 6. Online. Internet. August 1997. Available GOPHER: gopher.undp.org:70/00/unconfs/fish/fish1.
20. When Canadian fisheries regulations were developed, the English system of measurement was still the standard. This system has essentially been "grandfathered" in the fisheries regulations.
21. Some linguistic confusion is created by a concurrent practice to use the term 'inshore' to refer to only the small-boat fleet, and not the small-boat and longliner fleets together. This paper avoids using this terminology.
22. Carew (1987) estimates that 16 percent of vessels registered by full-time fishers, and 63 percent of those registered by part-time fishers, in the Newfoundland Region (NAFO Divisions 2+3KLPs) were inactive in 1985.
23. However, some of these trawlers are foreign flag vessels paying a royalty to the licencee. Approximately 25-30 percent of the northern shrimp catch is landed in Greenland (Sutherland 1990).
24. Needless to say, the returns and costs measured are private, and not social, returns. An estimate of social returns and costs in the Newfoundland groundfishery for the year 1978 was made in Roy, Schrank and Tsoa (1982). In most fleet sectors, costs exceeded earnings by an amount equal to about $1.50 for every dollar of catch. The same authors (Schrank et al. 1987) later calculated the amount of government expenditures on the Newfoundland fishery over the period 1972-80. For the year 1978, these constituted an amount equal to 1.7 times the value of the groundfish catch.
25. Department of Fisheries and Oceans, Canadian Fisheries Annual Statistical Review, Volume 22 1989 (Ottawa, 1996), Table 77.
26. Both Fisheries Products International and National Sea Products own major downstream secondary processing and marketing operations in the United States.
27. Because of the booming crab fishery, 12 new crab processing licences were issued by the province in 1997, over and above the existing 22 licences.
28. According to the DFO 1988 Survey of Atlantic Fishermen, 88 percent of full-time fishermen in Newfoundland were actively engaged in the fishery in that year, as opposed to only 37 percent of part-time fishermen.
29. In fact, by 1991 the Department of Fisheries and Oceans had tightened up eligibility for part-time status. New entrants had to be certified as a crew member for an existing full-time enterprise, and part-time fishermen who had not fished for two consecutive years in 1991 lost their fisherman's registration and any vessel registrations and species licences which they held (Donahue 1993). The number of registered part-time fishermen declined from 13,697 in 1990 to 10,225 in 1991.
30. Professional certification is considered a matter of labour standards, which is a subject matter under provincial jurisdiction. While the relevant provincial legislation was approved in 1996 in Newfoundland, the certification process is not fully in place, and is currently subject to grandfathering.
31. To qualify for membership in the core, Newfoundland fishers had to satisfy the following conditions:
(a) fished full-time in a seven year qualifying period (1989-1995 for active fishers, earlier for those affected by groundfish moratoria);
(b) must have a minimum of $3,000 and 75 percent of reported earned income form fishing during the fishing season for three out of the last four years of the qualifying period;
(c) must have operated a registered vessel using his own licence and reported a minimum of $5,000 in fishing income for inshore vessels (less than 35') or of $10,000 for nearshore vessels (35-65') with at least 50 percent of fishing activity on the fisher's own registered vessel, for two of the last three years of the qualifying period;
(d) hold a key licence -- groundfish (active), capelin, lobster, crab, scallop, shrimp, all species using purse seine, or (in Labrador) salmon or char.
Conditions (a) and (b) are the grandfathering requirements to achieve the Level II professionalization standard in Newfoundland (Department of Fisheries and Oceans, Atlantic Licencing Policy Reform Newfoundland Region, Backgrounder B-HQ-97-44E (Ottawa, 1995). Online. Internet. August 1997. Available HTTP: www.ncr.dfo.ca/communic/backgrou/1995/hq44e.htm).
32. A core enterprise with only one registered vessel, which is longer than 25', may register one additional vessel less than 25' long.
33. Department of Fisheries and Oceans, Supplementary Replacement Rules for Core Enterprises in the Newfoundland Region, Backgrounder number B-HQ-97-25 (Ottawa, 1997). Online. Internet. August 1997. Available HTTP: www.ncr.dfo.ca/communic/backgrou/1997/hq25e1.htm.
34. However, as recently as 1989, any full-time registered fisher in Newfoundland (outside of the Gulf of St. Lawrence) was free to register a vessel less than 35' long and obtain a groundfish fixed gear licence.
35. Fishery (General) Regulations, Fisheries Act, SOR/93-53, section 22. Online. Internet. August 1997. Available HTTP: www.ncr.dfo.ca/communic/policy/reg/FG-REG/fgrege.bin
36. There are exceptions -- for example, groundfish, salmon, some lobster, and temporary tuna licences -- in cases where the licence is temporary or where the number of licences is considered to be excessive. In these cases, a licence which is not renewed will be retired.
37. Salmon, however, is a special case. In 1992, the commercial fishery on the island portion of the province was closed indefinitely, and a license buy-back program was introduced. By January 1993, 91 percent of the total eligible licences (3,006) had been retired. The only active licences currently in use are for the Labrador coast.
38. Fisheries Act Chapter F-14, section 7. Online. Internet. August 1997. Available HTTP: www.ncr.dfo.ca/communic/policy/act/F-ACT/facte.bin.
39. The introduction by the industry of a two-price system based on crab size in 1996 has resulted in a considerable amount of highgrading (i.e., discarding of lower-valued sizes) of the catch. This is unquestionably a problem, and one which is endemic to IQ systems (Anderson 1994; Arnarson 1994), but one which is not clearly related to the number of participants. For example, the Enterprise Allocation system in offshore groundfish, with only three quota holders, was characterized by considerable highgrading at least in its early years (Crowley and Palsson 1992). This problem was alleviated (but apparently not eliminated) by the institution of 50 percent on-board observer coverage in 1986 -- a solution which clearly is not available to the snow crab fleet. Another possible solution would be to allocate quota for the two size-classes of crab separately. Such a system would require a considerable amount of 'fine-tuning' in quota allocations, and would probably not be workable in the absence of an active 'on-line' market for quota among the participants.
40. A fisherman would be able to combine regular employment and fishing for this purpose, so long as at least six weeks of qualifying employment was spent fishing.
41. Since 1989, the generosity of the program has been progressively reduced. In 1997, the system was renamed Employment Insurance, and replaced by an eligibility system based on hours of work instead of weeks of work. Benefits to repeat claimants are to be reduced (Department of Human Resources Development, The New Employment Insurance System(Ottawa, 1996). Online. Internet. August 1997. Available HTTP: www.hrdc-drhc.gc.ca/hrdc/ei/ina068_e.html). Fishers are now subjected to minimum levels of insured earnings in order to qualify for benefits, and payments to individual fishers are expected to decline by about 20 percent. The changes are also expected to impact particularly heavily on seasonal workers such as fish plant workers.
42. Schrank (1997) calculates that between fiscal years 1972 and 1990, the two levels of government spent nearly $4 billion on the Newfoundland fishery.
43. For example, in 1995, 237 groundfish licences (191 in Newfoundland) were retired, along with the associated vessel registrations, in return for $29 million, an average of $121,000 per licence.