|
Today, about 1.2 million of fishing vessels comb the oceans, pulling in 100 million tons of fish annually. They are more and more sophisticated, using satellite tracking, and nets that can catch more than 100 tons of fish at a time. Overfishing dramatically affects fish stocks, and hence the communities depending on this industry - not to mention the billions of people worldwide who rely on fish as their main source of protein. Climate change also contributes to the depletion of fish resources. But fish stock-environment relationships have proven difficult to quantify with traditional methods, and there is a strong need for policy-makers and resource managers to have a clear view of these dynamics.
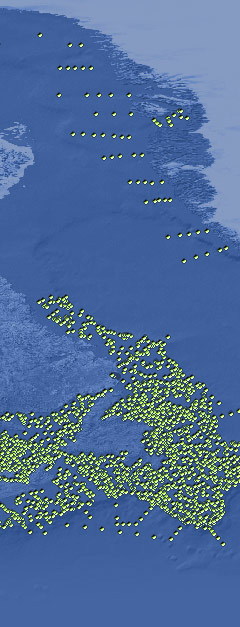
In order to draw an accurate picture of the evolution of fish stocks and their interactions with environmental changes, the whole issue has to be considered through space and time. Geographic Information Systems (GIS), which are powerful software programs for gathering, storing, interpreting, and delivering geographic data, offer the technology to meet such needs. Therefore, this project aims at developing a GIS-based decision-support tool to provide fishery managers with comprehensive and accurate analyses of changing marine ecosystems, to develop new policies.
|
|