|
|
|
|
|
|
 |
|
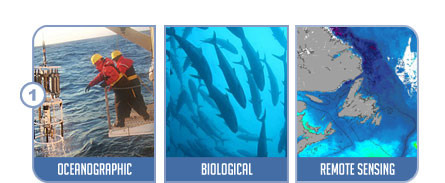
| Various data collected over the past 30-40 years in the NW Atlantic region are collected from a variety of organisations. These include oceanographic data (temperature, salinity, nutrients), biological data (Canadian and US Fisheries scientific surveys as well as Fisheries observer program for the four targeted species) and remote sensing data (sea-surface temperature and biological productivity). |
| |
 |
|
| The data cover different regions, for different times, and are recorded in a variety of different formats. This step involves checking for the quality of the data, homogenising their structure, and integrating them into a GIS environment. |
| |
 |
|
| Most data were collected at specific locations in space and time (points). Using the stratified kriging technique, this step generates, if the data are sufficient, continuous surfaces from the punctual surveys (for fisheries and oceanographic data). |
| |
 |
|
| Once the data are integrated and interpolated, they can be analysed using geographic techniques. Various techniques from the field of spatial statistics will be used to analyse the data through space and time (e.g. Regression Trees, Moran/Getis, Geographically Weighted Regressions, Cluster analysis). |
| |
 |
|
| The prototype of a visualisation system for fisheries data, developed in ArcGIS, will be designed to allow fisheries specialists to explore and analyse the data through space and time. |
| |
| |
| |
|
|
|
|
|